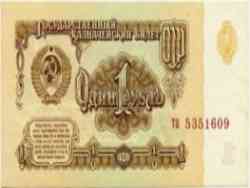

Current salary in Soviet rubles
The basis was taken that notorious consumer basket, in which was added a movie ticket, the fare in public transport in the cities, and the cost of hairstyles “Youth” and its current equivalent in hairdressing. On the basis of the basket for each year was calculated by PPP (purchasing power parity) and, consequently, the ratio of the current to the Soviet ruble. For the Soviet ruble was taken rouble 1987 – the year in which was achieved the highest standard of living.
Year
The average salary in negotiable rubles appropriate time
The average salary in rubles of the 1987
The circulating rate of the ruble to the Soviet ruble of the 1987
Average salary in US dollars at the appropriate time average annual official rate
1987
185,01
185,01
1
276,13
1988
199,79
187,42
1,066
344,46
1989
217,74
192,69
1,13
359,31
1990
248,40
177,42
1,4
409,22
1991 (December)
548
48,2
At 11.37
101,361 at the commercial rate of the state Bank
1992
5995
25,76
232,73
23,96
1993
58663
36,52
1606
140,67
1994
220351
36,0
6121
66,85
1995
472392
37,65
12547
130,38
1996
845651
71,34
11853
181,39
1997
982156
78,74
12473
176,58
1998
1051,5
44,74
23,5
80,22
1999
1522,6
40,82
37,3
73,69
2000
2223
64,24
34,6
82,33
2001
3240
76,77
42,2
115
2002
4360
68,77
63,4
139
2003
5498
104,52
52,6
179
2004
6740
124,51
54,13
234
2005
8555
132,02
64,8
297
2006
10634
145,81
72,93
404
2007
13527
140,42
96,33
529
2008
17112
154,16
111
691
2009
19247,1
128,32
150
658
2010
21898,8
135,18
162
711,41
2011
24310
144,71
168
797
2012
26489
153,89
172,12
802
2013
26689
141,04
189,22
807,03
2015
28234
113.66
248.40
434.36